What the spec records, and what a style layer still owns
Declare a figure’s size, type and colours in the spec: the Figure fields that own layout and sizing, the Palette that owns every colour, and the style layers underneath them.
A figure’s look is part of its specification, not something applied to it afterwards. Size, type size, spines, panel lettering and colour are all declared, so re-rendering a study on another machine produces the same picture, and changing a journal’s column width is one edit rather than a pass over every plotting script.
Two things carry that look. The Figure itself owns its print size and lettering, and everything else — colour and the geometry a style sheet used to own — is a Theme: one object naming what each colour means and how thick a tick is, rather than a hex written wherever a line is drawn and a .mplstyle sitting outside the spec where nothing validates it.
What the spec records
These are fields of the Figure, so they are read from the YAML and never from a stylesheet:
Field
What it fixes
width, height
Physical print size in mm.
dpi
Raster resolution. Scales pixels only, never the physical size or the type size.
font_size
Base type size in points, unchanged by width or dpi.
format
Output format (pdf/svg/png).
layout, height_ratios, width_ratios
The mosaic and the relative size of its rows and columns.
spines, spine_offset
box (all four, closed) or open (left and bottom), and how far they sit outside the data.
Panel lettering: whether, how spelled, which corner, how far in, how large.
trim_margins, pad
Whether the save re-crops to the drawn content, and how much whitespace is left when it does.
share_x, share_y
Panel groups that end on one scale.
auto_format
bsplot’s tick and label normalisation. Set false to keep full manual control.
Because these are declared, a figure states its print size rather than inheriting one:
figures:-name: Fig2layout:"ab/cc"width:180 # mm, a two-column journal figureheight:120font_size:8spines: openpanel_numbers:truepanel_number_loc: upper lefttheme:{iri: tvbo:theme/default}
Tip
Set width and font_size together. Type size is in points and independent of the figure size, so shrinking a figure without raising its font_size is what produces the unreadable labels a reviewer will ask about.
The theme
A theme is one object carrying a project’s whole look. Start from TVB-O’s, curated in the database, and state only what you change — the same iri + merge that an Observation or a Coupling uses:
A slot left unset is not a value: the layer underneath keeps it. So a theme states the look it means to fix and nothing else.
Colours are named, never written
A theme gives colours roles. A panel asks for the role, so recolouring a project is one edit and every figure follows:
Role
What it is for
ink
Text, spines and ticks: the near-black everything is read against.
base
Lines, bars and markers wherever the colour carries no meaning. Leads the cycler.
muted
Hairlines and de-emphasised strokes: present, and not competing.
highlight
The single emphasis colour.
background
The page the figure is printed on.
palette
The categorical hues, reached into only where a panel separates conditions.
Two rules make this work. The cycler is [base] + palette, so a plot that names no colour comes out in the neutral and only a panel that means to separate conditions gets hues. And highlight is deliberately outside the cycler, because a colour handed to the second line of every plot cannot also mean this is the point.
Anywhere a figure names a colour, a role or a hue is accepted in place of a hex — Style.color, a rule’s or a region’s color, and the flat color of a surface or network panel:
Anything that is not a role passes through untouched, so #0a5170, tab:blue and red keep working exactly as before.
Note
Encoding.color is not a colour. encoding: {x: time, y: rate, color: node} names the field whose values separate the marks, and draws one line per node from the cycler. To fix a mark’s colour, use Style.color.
Continuous scales
colormaps is an open namespace. sequential and diverging are always present, because they are the two the renderer reaches for on its own; everything else is a key you name:
A layer then names the key (style: {colormap: meg}), and anything the theme did not declare falls through to the backend’s own registry, so inferno, coolwarm and parula still work. A key that shadows a registered colormap name is refused at load rather than silently redirecting every use of it.
A mark that names no scale is not left to matplotlib’s default: it takes sequential, or diverging when its limits are centred, because a map of signed deviations read on a one-directional ramp is misleading in a way no axis label catches.
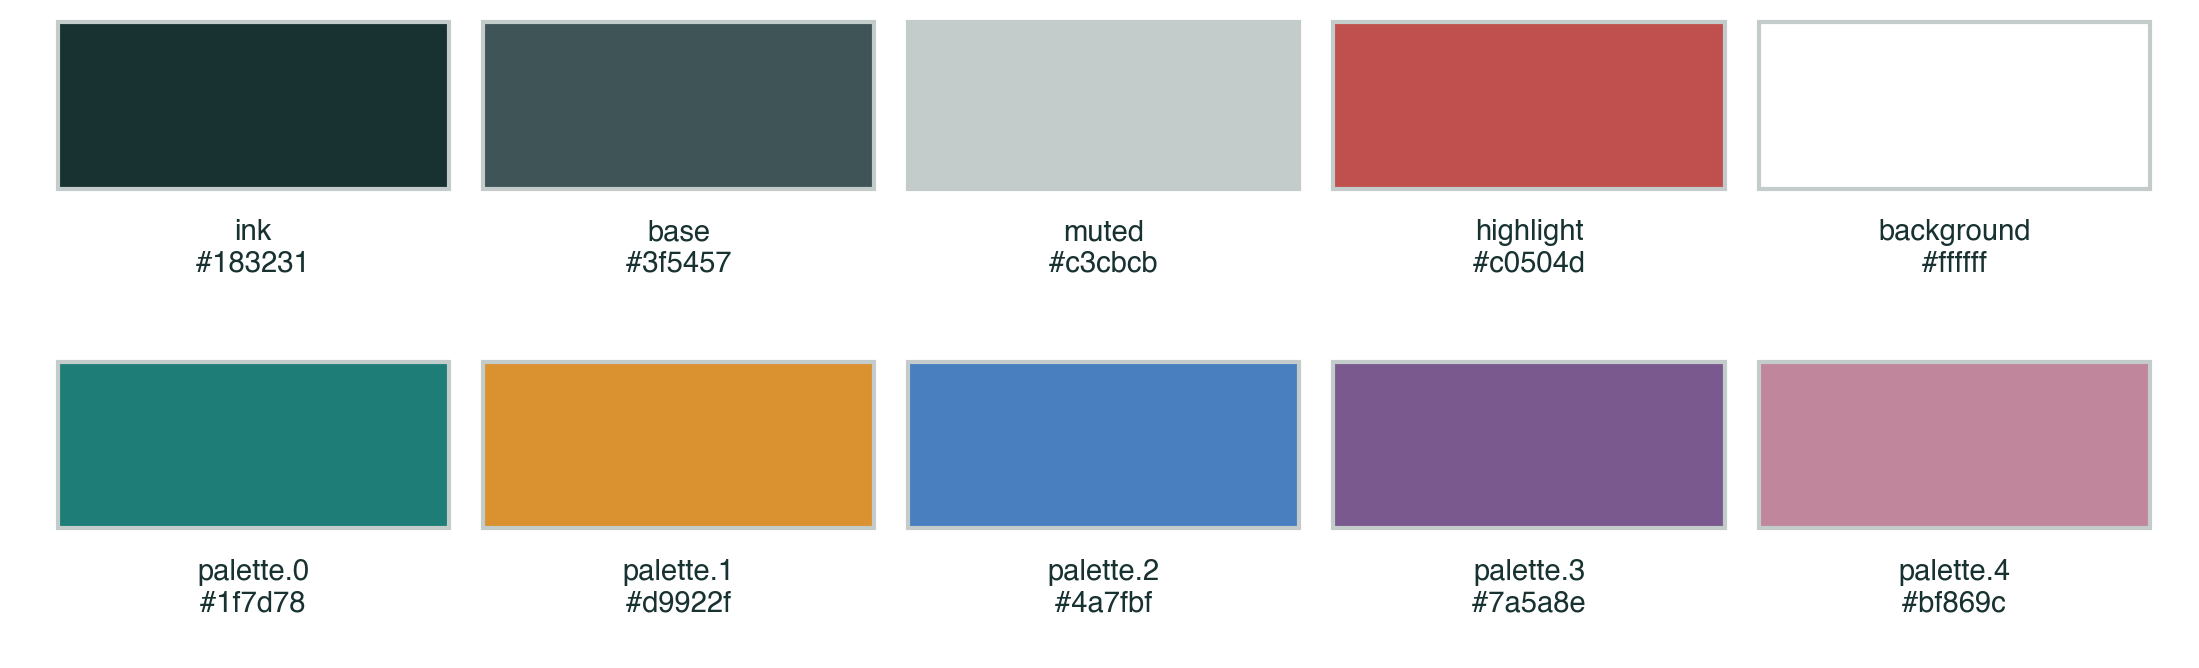
import matplotlib.pyplot as pltfrom tvbo.plot import paletterows = [("roles", [palette.color(r) for r in palette.ROLES], palette.ROLES), ("palette", palette.palette(), [f"palette.{i}"for i inrange(len(palette.palette()))])]fig, axes = plt.subplots(2, 1, figsize=(7.5, 2.4))for ax, (_, colours, labels) inzip(axes, rows):for i, (c, label) inenumerate(zip(colours, labels)): ax.add_patch(plt.Rectangle((i, 0), 0.92, 1, facecolor=c, edgecolor=palette.muted())) ax.text(i +0.46, -0.18, f"{label}\n{c}", ha="center", va="top", fontsize=7, color=palette.ink()) ax.set_xlim(-0.1, len(colours)); ax.set_ylim(-0.75, 1.05); ax.set_axis_off()fig.tight_layout()
Figure 1: The shipped theme: the five roles, then the categorical hues in the order the cycler hands them out.
The geometry a sheet used to own
Slot
What it fixes
tick_length, tick_width, tick_direction, tick_pad
Major tick marks: how long, how heavy, which way, how far from their labels.
minor_ticks, minor_tick_length, minor_tick_width
Whether minor ticks are drawn, and their shape.
axis_width
Weight of the axes frame. A figure whose spines are heavier than its data is drawn the wrong way round.
label_pad, title_pad
Distance from an axis label, and from a panel title, to the axes.
line_width, marker_size
Defaults for any layer whose own style does not fix one.
legend_frame, legend_handle_length, legend_pad
The legend box, its sample line, and how far it sits from the axes. TVB-O’s own theme is the one place that decides keys are unboxed; a panel overrides it with legend: {frame: true}.
grid_lines
Whether the grid is drawn. Off in most journals, and worth stating either way. Named in full because a panel’s grid: is the tiling of a kind: grid, and one word cannot mean both.
font_family
Typefaces, most-wanted first. A generic family first (sans-serif) selects that family outright.
Type size is not here: Figure.font_size owns it, because it is a property of the figure’s print size rather than of the project’s look.
Overriding it per panel
A panel states the same words to override the theme for itself — tick_length, tick_size, tick_prune, nbins, xticks, yticks, hide_xticklabels, hide_yticklabels, xtick_rotation, ytick_rotation, xtick_format, ytick_format, xtick_side, ytick_side. One vocabulary, so a figure-wide default and a single panel’s exception are the same slot at two levels:
Three of them have no theme-wide twin on purpose. tick_size would fight Figure.font_size, and nbins and tick_prune answer to one panel’s neighbours — where a corner tick collides, how dense a cell is — rather than to the project’s look.
Reference lines, shaded regions and the 3-D viewpoint are declared here too, each carrying the colour that has to travel with it:
So is the rest of the panel’s frame — its labels, limits, scales and shape — which the figure spec page lays out in full. Nothing about how an axis is drawn is an option any more: a spec written against the older flat spelling (axvline beside axvline_color, elev beside azim, a legend that meant a boolean in one panel and a corner in the next) is refused with the replacement named, and python scripts/migrate_panel_marks.py <tree> converts a study and reports anything it cannot convert safely.
Style layers
Figure.style is what sits underneath the theme, and it is for looks TVB-O does not own: bsplot’s registered styles, a journal’s sheet, the rcParams of a paper being reproduced.
Written as
What it contributes
tvbo, nature
A registered bsplot style: the house look in one word.
style/study.mplstyle
A study’s own matplotlib defaults, for anything the spec has no field for.
tvbo-palette
An alias for theme: {iri: tvbo:theme/default}, kept because it reads well in a list.
Whatever the theme states beats every layer, always. That is the whole point of separating them: a figure’s look can be read off its own spec instead of reconstructed from the sheets underneath it, and a sheet cannot quietly reintroduce a colour cycle the project has replaced.
A palette YAML is no longer a style layer. Naming one raises, and says to declare it as the theme instead.
Reaching for a sheet is deliberate. style: [tvbo] is the default when nothing is declared, and a replication that must reproduce a paper’s own colours declares its own sheet and does not add a theme that would overwrite them.
Your own theme
A theme is an ordinary TVB-O document, so a project can keep one in a file and include it:
Because it declares its class, tvbo validate schema style/house.yaml checks it like any other document, and a misspelt role is refused rather than silently ignored. Different figure sets can carry different themes — a YAML anchor is usually enough:
A custom panel draws with matplotlib directly, so it reads the palette rather than the spec:
from tvbo.plot import paletteprint("roles ", palette.ink(), palette.base(), palette.muted(), palette.highlight())print("one hue ", palette.color("palette.1")) # counting from zeroprint("first three", palette.palette(3))print("cycler ", palette.cycle()) # [base] + paletteprint("diverging ", palette.colormap("diverging").name)print("ordinal ", len(palette.ramp(4)), "steps sampled across the sequential scale")
roles      #183231 #3f5457 #c3cbcb #c0504d
one hue    #d9922f
first three ['#1f7d78', '#d9922f', '#4a7fbf']
cycler     ['#3f5457', '#1f7d78', '#d9922f', '#4a7fbf', '#7a5a8e', '#bf869c']
diverging  RdBu_r
ordinal    4 steps sampled across the sequential scale
palette.ramp(n) is what an ordered set of classes should use. A ladder of rungs or a set of ordered bins is not categorical, and drawing it in palette() hues tells the reader the classes are unrelated when the whole point is that they are not.
To make a palette current inside a script, hand use() a path or a mapping:
palette.use("style/my_palette.yaml")
That also writes the colours into the matplotlib rcParams that carry them, so text.color, image.cmap, the facecolors and the cycler all follow, and code that names no colour at all still comes out in the project’s.
What a sheet still owns
The theme covers what six real study sheets agreed on, not all of matplotlib. A sheet is still the way to fix the long tail — mathtext.fontset, lines.solid_capstyle, patch.linewidth, per-axis label colours. A project that needs one ships it and names it in style:; the theme still wins over it on everything it does state.
See also
Specify a figure: the mosaic, the panels and the layers the styling applies to