Dynamics Database Gallery

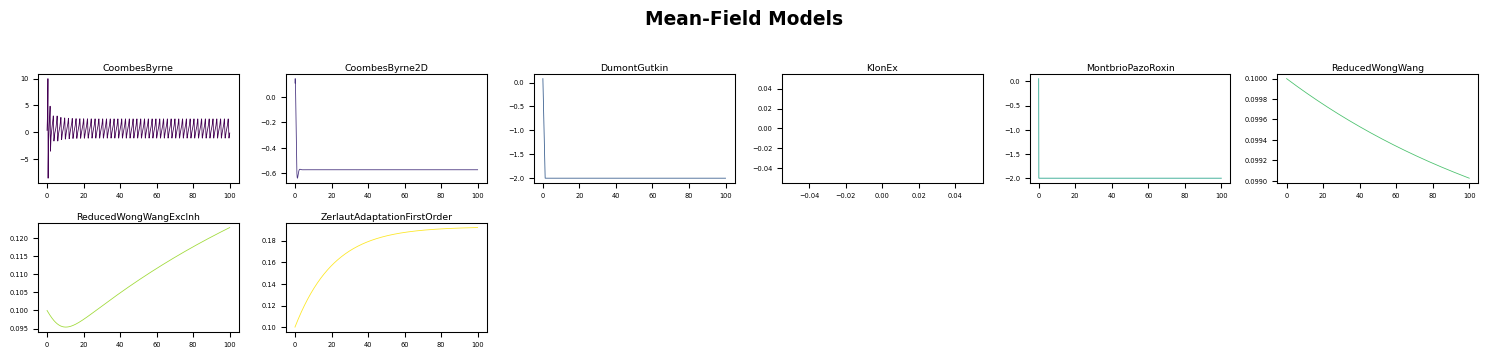
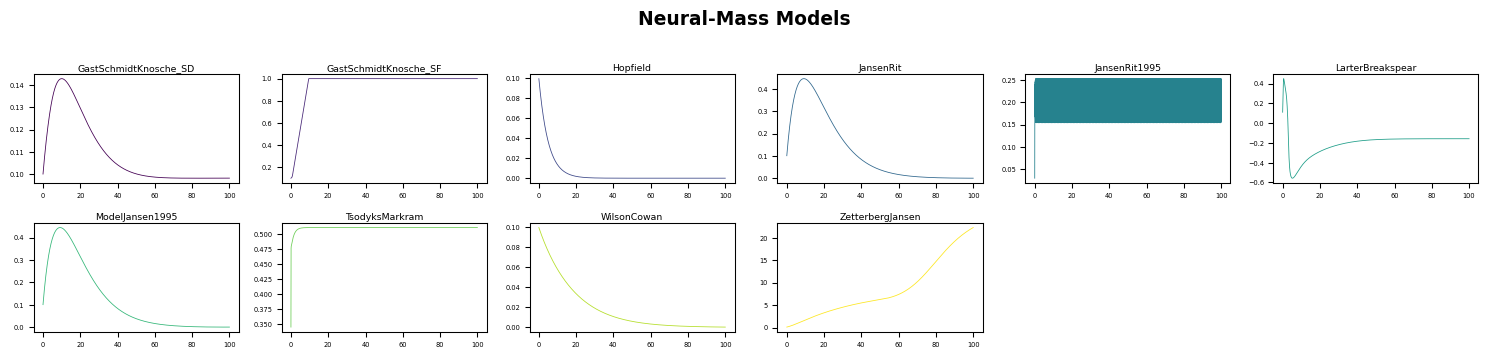
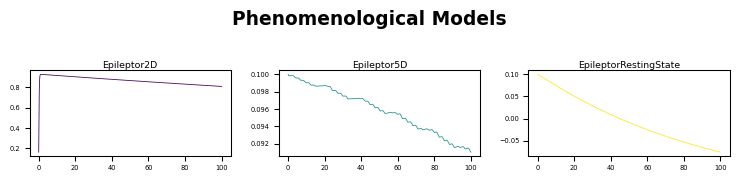
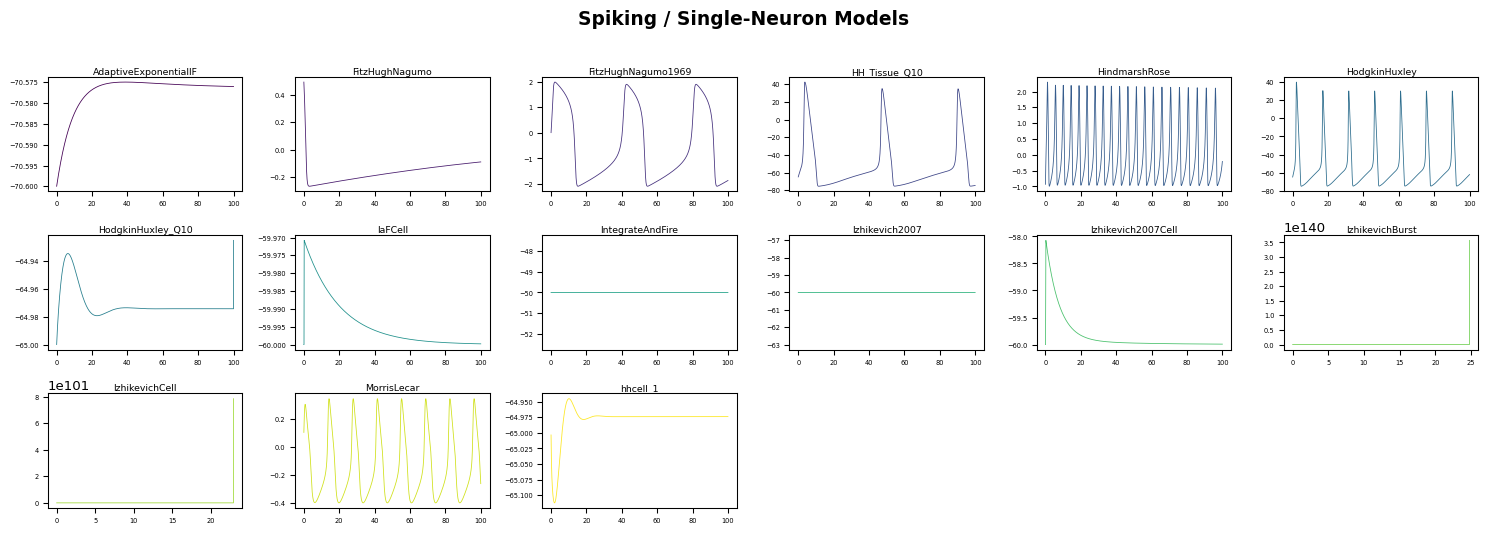
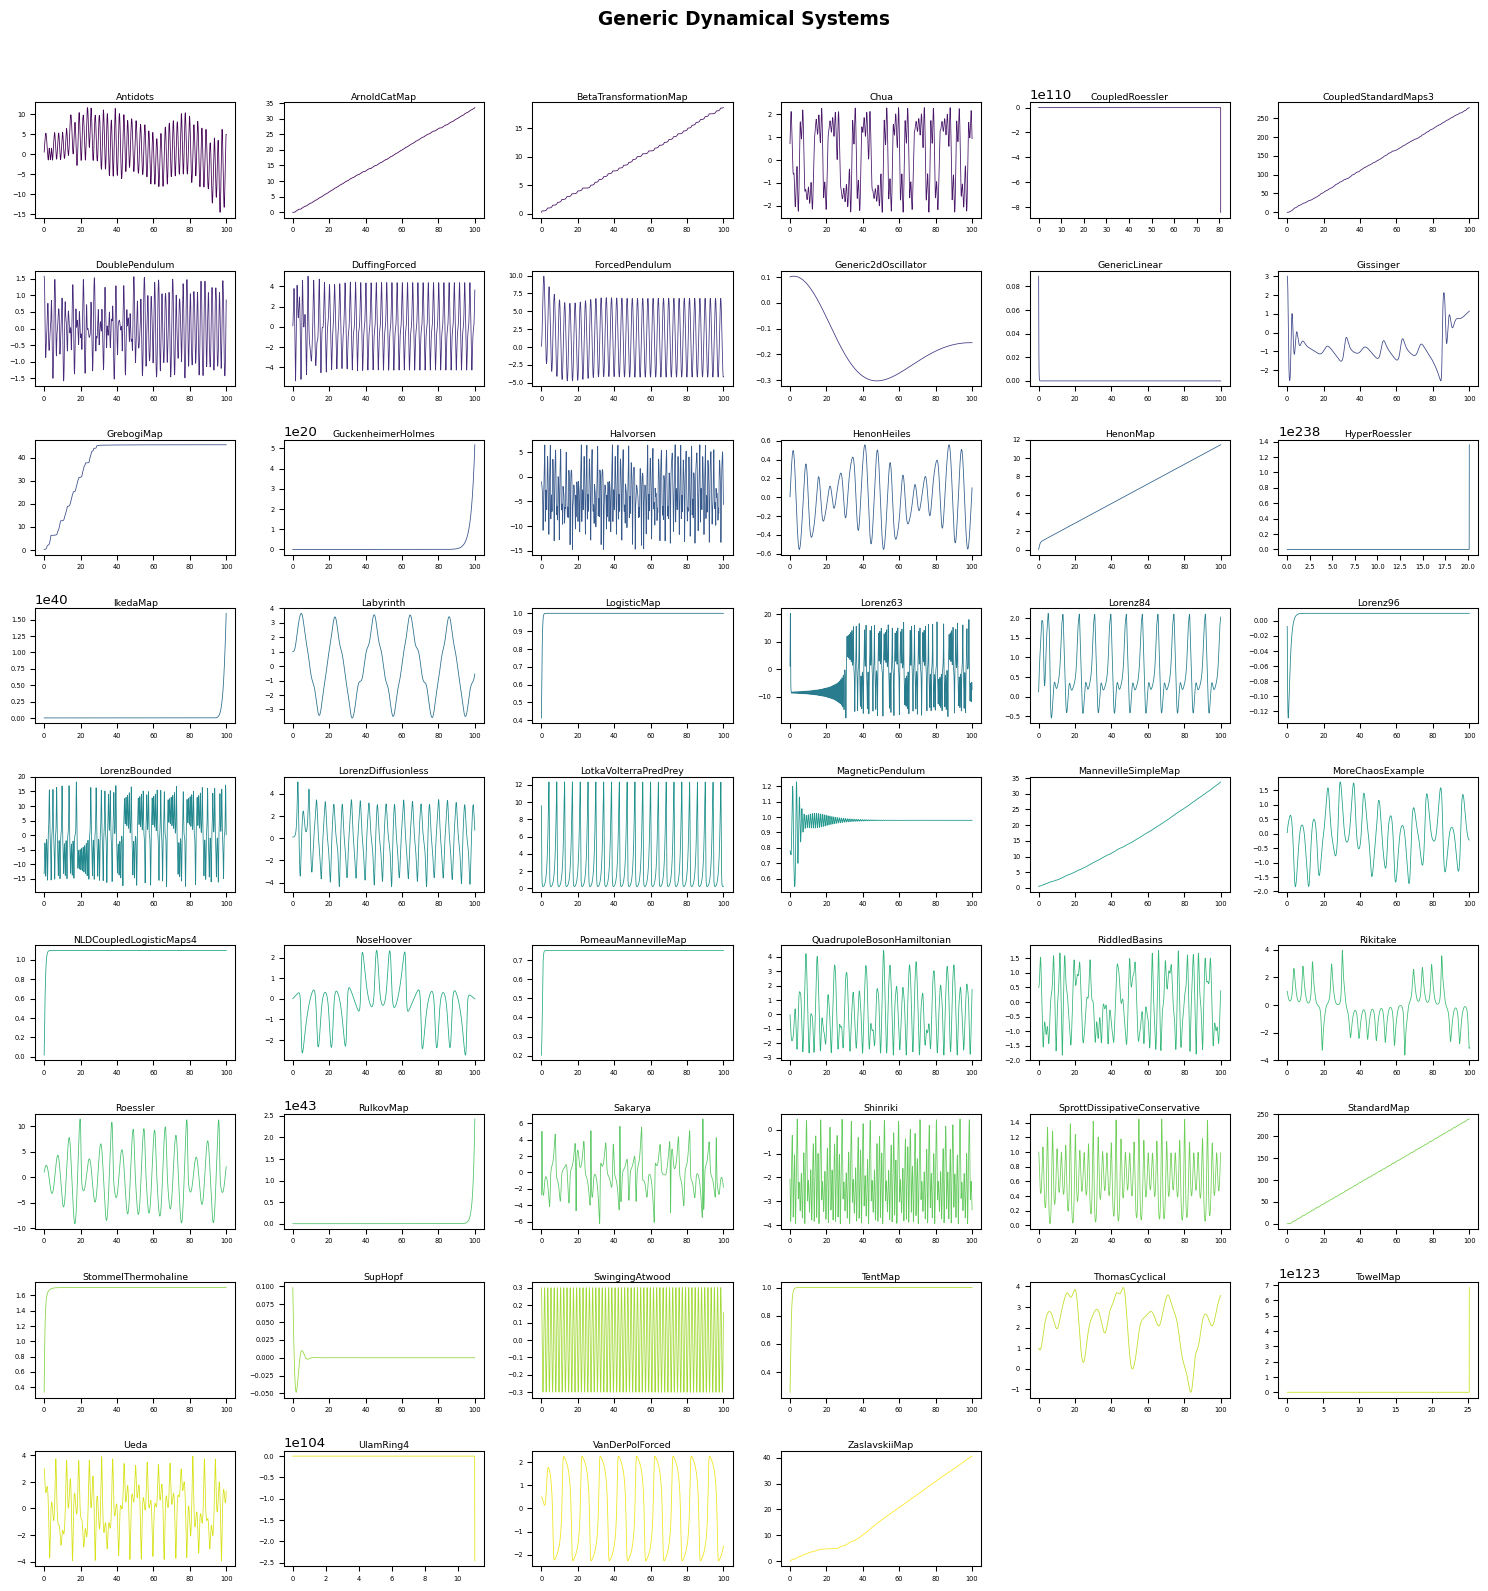
Overview of all models in the TVBO database, organised by category.

All 93 models from the TVBO database simulated for 100 ms and plotted by category. Each panel shows the first state variable; colours are sampled from the viridis colourmap.

Code
import warnings, logging
warnings.filterwarnings("ignore")
logging.disable(logging.WARNING)

import numpy as np
import matplotlib.pyplot as plt
from matplotlib.colors import Normalize
from matplotlib.cm import ScalarMappable
from tvbo import Dynamics, SimulationExperiment
Code
DURATION = 100.0          # ms
CATEGORIES = [
    ("mean_field",        "Mean-Field Models"),
    ("neural_mass",       "Neural-Mass Models"),
    ("phase_oscillator",  "Phase-Oscillator Models"),
    ("phenomenological",  "Phenomenological Models"),
    ("spiking",           "Spiking / Single-Neuron Models"),
    ("generic",           "Generic Dynamical Systems"),
]

results = {}   # model_type -> [(name, data_array)]
for cat, _ in CATEGORIES:
    results[cat] = []
    for name in Dynamics.list_db(model_type=cat):
        try:
            d = Dynamics.from_db(name)
            exp = SimulationExperiment(dynamics=d)
            exp.integration.duration = DURATION
            r = exp.run()
            da = r.integration.data
            results[cat].append((name, da))
        except Exception:
            pass  # skip models that fail to run
Code
cmap = plt.get_cmap("viridis")

for cat, title in CATEGORIES:
    items = results[cat]
    if not items:
        continue
    n = len(items)
    ncols = min(6, n)
    nrows = int(np.ceil(n / ncols))
    fig, axes = plt.subplots(
        nrows, ncols,
        figsize=(ncols * 2.6, nrows * 1.8),
        squeeze=False,
    )
    fig.suptitle(title, fontsize=14, fontweight="bold", y=1.02)
    colors = [cmap(i / max(n - 1, 1)) for i in range(n)]

    for idx, (name, da) in enumerate(items):
        ax = axes[idx // ncols, idx % ncols]
        y = da.isel(variable=0).values
        t = da.coords["time"].values
        ax.plot(t, y, color=colors[idx], linewidth=0.6)
        ax.set_title(name, fontsize=7, pad=2)
        ax.tick_params(labelsize=5)
        ax.set_xlabel("")
        ax.set_ylabel("")

    # hide unused axes
    for idx in range(n, nrows * ncols):
        axes[idx // ncols, idx % ncols].set_visible(False)

    fig.tight_layout()
    plt.show()

Summary

Code
import pandas as pd
rows = []
for cat, title in CATEGORIES:
    attempted = len(Dynamics.list_db(model_type=cat))
    succeeded = len(results[cat])
    rows.append({"Category": title, "Available": attempted, "Plotted": succeeded})
pd.DataFrame(rows)
Table 1
Category Available Plotted
0 Mean-Field Models 8 8
1 Neural-Mass Models 10 10
2 Phase-Oscillator Models 3 3
3 Phenomenological Models 3 3
4 Spiking / Single-Neuron Models 17 15
5 Generic Dynamical Systems 52 52