---
title: "Bayesian Parameter Inference with NumPyro"
subtitle: "A small predator–prey model, two unknown parameters, and two inference methods"
format:
html:
code-fold: false
toc: true
jupyter: python3
---
Try this notebook interactively:
[Download .ipynb](https://github.com/virtual-twin/tvboptim/blob/main/docs/basics/bayesian_inference.ipynb){.btn .btn-primary download="bayesian_inference.ipynb"}
[Download .qmd](https://github.com/virtual-twin/tvboptim/blob/main/docs/basics/bayesian_inference.qmd){.btn .btn-secondary download="bayesian_inference.qmd"}
[Open in Colab](https://colab.research.google.com/github/virtual-twin/tvboptim/blob/main/docs/basics/bayesian_inference.ipynb){.btn .btn-warning target="_blank"}
How uncertain are the parameters fitted to a noisy recording? This tutorial uses
**tvboptim to simulate a dynamical system** and **NumPyro to infer a distribution
over its unknown parameters**. We first use the No-U-Turn Sampler (NUTS), then
approximate the same posterior with stochastic variational inference (SVI).
We compare parameter distributions, credible intervals, and predictions from
the two methods. The [stimulation case study](../workflows/Stimulation_Prior_Sensitivity.qmd)
then examines what a recording can distinguish and how prior assumptions affect
the inferred parameters.
The example runs on one device, with two sampling chains run sequentially
and one variational fit. Initial calls include JAX compilation; subsequent
simulation calls reuse the compiled code.
Our example is the Lotka–Volterra predator–prey model, also used in
[NumPyro's ordinary differential equation (ODE) tutorial](https://num.pyro.ai/en/stable/examples/ode.html) and
[Bob Carpenter's Stan case study](https://mc-stan.org/learn-stan/case-studies/lotka-volterra-predator-prey.html).
We use synthetic data and infer only two rates to keep the example small.
## 1. A small forward model
Let $x$ be prey abundance and $y$ predator abundance:
$$
\frac{dx}{dt} = \alpha x - \beta xy,
\qquad
\frac{dy}{dt} = \delta xy - \gamma y.
$$
Prey grow at rate $\alpha$ and are consumed through the interaction $\beta xy$.
Predators decline at rate $\gamma$ and grow through the interaction $\delta xy$.
We will infer **$\alpha$ and $\gamma$**, fixing $\beta=\delta=1$ and both initial
abundances at 1. Time and abundance use arbitrary, consistent units.
Install `tvboptim`, `numpyro`, and `matplotlib` in your Python environment before
running the cells. Enable 64-bit arithmetic before creating arrays to give the
ODE calculation and inference more numerical precision.
```{python}
#| echo: false
#| output: false
try:
import google.colab
except ImportError:
pass
else:
import subprocess
import sys
subprocess.check_call([sys.executable, "-m", "pip", "install", "-q",
"tvboptim", "numpyro", "matplotlib"])
```
```{python}
#| code-fold: true
#| code-summary: "Imports and numerical precision"
import jax
jax.config.update("jax_enable_x64", True)

import jax.numpy as jnp
import matplotlib.pyplot as plt
import numpyro
import numpyro.distributions as dist
from numpyro.infer import MCMC, NUTS, Predictive, SVI, Trace_ELBO
from numpyro.infer.autoguide import AutoMultivariateNormal
from numpyro.infer.initialization import init_to_value
from numpyro.optim import Adam

from tvboptim.experimental.network_dynamics import Network, prepare, Bunch
from tvboptim.experimental.network_dynamics.dynamics.base import AbstractDynamics
from tvboptim.experimental.network_dynamics.graph import DenseGraph
from tvboptim.experimental.network_dynamics.solvers import RungeKutta4
```
This example uses tvboptim's experimental Network Dynamics interface.
The following class supplies the two equations. See
[custom dynamics](../network_dynamics/dynamics.qmd#creating-custom-dynamics)
for the interface in more detail. A single node holds both populations; it has
no connections or coupling.
```{python}
class LotkaVolterra(AbstractDynamics):
    STATE_NAMES = ("prey", "predator")
    INITIAL_STATE = (1.0, 1.0)
    DEFAULT_PARAMS = Bunch(alpha=1.5, beta=1.0, gamma=1.0, delta=1.0)
    COUPLING_INPUTS = {}

    def dynamics(self, t, state, params, coupling, external):
        x, y = state
        return jnp.stack([
            params.alpha * x - params.beta * x * y,
            params.delta * x * y - params.gamma * y,
        ])


network = Network(
    dynamics=LotkaVolterra(),
    coupling={},
    graph=DenseGraph(jnp.zeros((1, 1))),
)
solve_fn, base_config = prepare(
    network, RungeKutta4(), t0=0.0, t1=6.0, dt=0.02,
)
# Native solvers store post-step states: indices 9, 19, … give times 0.2, 0.4, ….
solver_times = solve_fn(base_config).ts
obs_idx = jnp.arange(9, len(solver_times), 10)
times = solver_times[obs_idx]


def predict(alpha, gamma):
    config = base_config.copy()
    config.dynamics.alpha = alpha
    config.dynamics.gamma = gamma
    # Solver output: (time, state variable, node).
    return solve_fn(config).ys[obs_idx, :, 0]
```
`predict` is the bridge between the two libraries: it takes parameter values and
returns a `(30, 2)` array at times 0.2, 0.4, …, 6.0. Each call copies the prepared
configuration so it does not change the shared template. JAX can differentiate
through the simulation.
## 2. Generate noisy observations
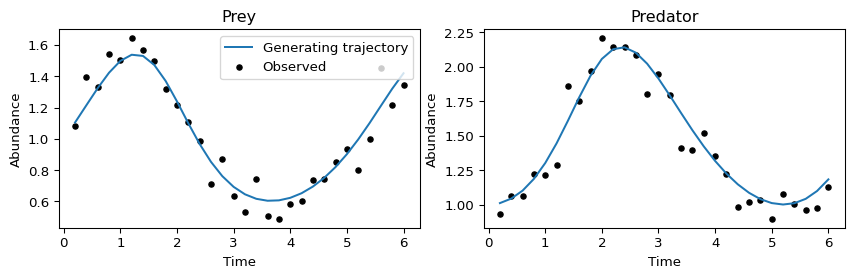
We observe both populations with independent Gaussian measurement noise of known
standard deviation $\sigma=0.1$. The dynamics themselves are deterministic.
This additive noise is a simple measurement model for these synthetic abundance
values; other measurements may require a different likelihood.
```{python}
truth = {"alpha": 1.5, "gamma": 1.0}
sigma = 0.1
clean = predict(**truth)
observed = clean + sigma * jax.random.normal(jax.random.key(0), clean.shape)
```
```{python}
#| code-fold: true
#| code-summary: "Plot the synthetic observations"
fig, axes = plt.subplots(1, 2, figsize=(9, 3), sharex=True)
for i, (ax, name) in enumerate(zip(axes, ("Prey", "Predator"))):
    ax.plot(times, clean[:, i], label="Generating trajectory")
    ax.scatter(times, observed[:, i], s=15, color="black", label="Observed")
    ax.set(xlabel="Time", ylabel="Abundance", title=name)
axes[0].legend()
fig.tight_layout()
plt.show()
```
## 3. State the probabilistic model
A **prior** describes parameter uncertainty before using these observations.
The **likelihood** describes how observations vary around a simulated trajectory.
The **posterior** combines them. Writing the observed abundances as $z$:
$$
p(\alpha,\gamma\mid z)
\propto p(z\mid\alpha,\gamma)\,p(\alpha)\,p(\gamma).
$$
We choose independent log-normal priors to keep the rates positive. Both have
median 1 and standard deviation 0.3 **on the log scale**. These are moderately
concentrated teaching priors that should be reconsidered for other models.
The observation noise matches the data generation above.
```{python}
def model(data=None):
    alpha = numpyro.sample("alpha", dist.LogNormal(0.0, 0.3))
    gamma = numpyro.sample("gamma", dist.LogNormal(0.0, 0.3))
    trajectory = predict(alpha, gamma)
    numpyro.deterministic("trajectory", trajectory)
    numpyro.sample("obs", dist.Normal(trajectory, sigma).to_event(2), obs=data)
```
`numpyro.sample` names the unknown parameters and records their densities. With
`obs=data`, the last line scores the actual measurements. With `data=None`, it
instead generates hypothetical observations. `.to_event(2)` sums the independent
Normal log densities across times and populations; it does not add correlations.
There are no tvboptim `Parameter` wrappers here: NumPyro's sample sites identify
the unknowns and manage their positivity transformations.
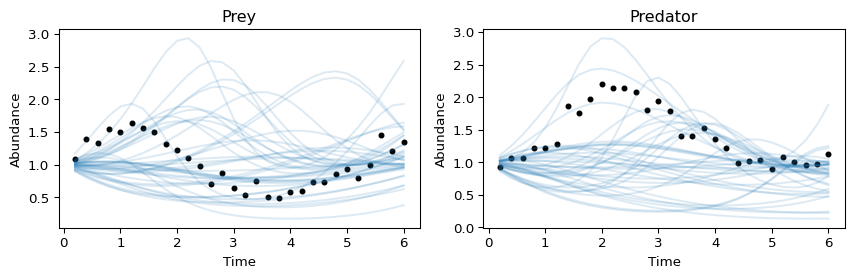
Before fitting, inspect noiseless trajectories from prior parameter draws.
Their spread shows the response uncertainty before conditioning on the recording.
For a real application, use scientific knowledge to assess whether these
trajectories are plausible.
```{python}
prior = Predictive(model, num_samples=40)(jax.random.key(1))
```
```{python}
#| code-fold: true
#| code-summary: "Plot trajectories drawn from the prior"
fig, axes = plt.subplots(1, 2, figsize=(9, 3))
for i, ax in enumerate(axes):
    ax.plot(times, prior["trajectory"][:, :, i].T, color="tab:blue", alpha=0.15)
    ax.scatter(times, observed[:, i], s=12, color="black")
    ax.set(xlabel="Time", ylabel="Abundance", title=("Prey", "Predator")[i])
fig.tight_layout()
plt.show()
```
## 4. Sample with Hamiltonian Monte Carlo (HMC)
HMC is a Markov chain Monte Carlo (MCMC) method. It uses gradients of the log
posterior and auxiliary momentum to propose moves through parameter space.
NUTS is an HMC variant that adapts the trajectory length. During warmup it also tunes
sampling parameters; warmup draws are excluded from the reported posterior.
Each gradient evaluation differentiates through our ODE solve. NUTS targets the
posterior defined by the priors, likelihood, and numerical solver, but a finite
run can explore it poorly. Diagnostics are part of the inference.
```{python}
mcmc = MCMC(
    NUTS(model),
    num_warmup=400,
    num_samples=600,
    num_chains=2,
    chain_method="sequential",
    progress_bar=False,
)
mcmc.run(jax.random.key(2), data=observed)
mcmc.print_summary(exclude_deterministic=True)
print("Divergences:", int(mcmc.get_extra_fields()["diverging"].sum()))
nuts_samples = {name: mcmc.get_samples()[name] for name in truth}
```
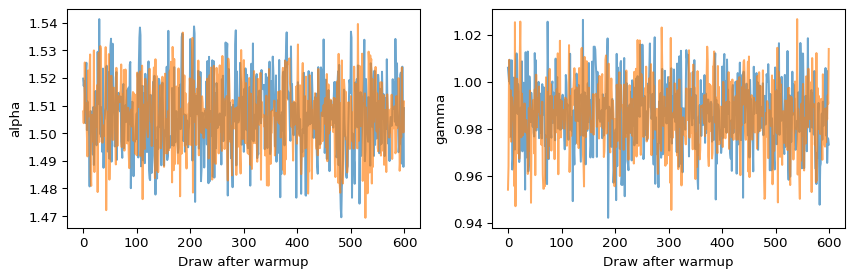
Check $\hat R$ (R-hat), which compares variation within and between chains,
effective sample size (ESS, reported as `n_eff`), and divergences. Look for R-hat
at most 1.01, ESS of at least 200 for each inferred parameter, and no divergences;
inspect chain traces as well. These are the screening thresholds used in the
stimulation case study. The precision needed for a particular estimate,
especially a tail probability, may require a larger ESS.
A divergence flags excessive numerical error along a Hamiltonian trajectory
and can indicate that parts of the posterior are poorly explored. Investigate
parameter scaling and model geometry; a higher `target_accept_prob` reduces
the integration step size and may help. If ESS is low or R-hat is high, inspect
chain mixing and initialization before extending the run. Also check the forward
solver's numerical accuracy. Passing these checks does not prove convergence or
establish that disconnected posterior modes are absent.
```{python}
#| code-fold: true
#| code-summary: "Inspect the two sampling chains"
chains = mcmc.get_samples(group_by_chain=True)
fig, axes = plt.subplots(1, 2, figsize=(9, 3))
for ax, name in zip(axes, truth):
    ax.plot(chains[name].T, alpha=0.65)
    ax.set(xlabel="Draw after warmup", ylabel=name)
fig.tight_layout()
plt.show()
```
## 5. Approximate the same posterior with SVI
SVI chooses a distribution $q_\phi$, called a **guide**, and adjusts its
parameters $\phi$ to approximate the posterior. It maximizes the evidence lower
bound (ELBO), trading off fit to the data against departure from the prior.
Here the stochasticity comes from Monte Carlo estimates of the objective; we
use all observations on every step.
`AutoMultivariateNormal` learns a Gaussian with correlations in the unconstrained
coordinates (here, log rates). This makes fitting convenient, but cannot describe
arbitrary posterior shapes or separated modes. See the
[NumPyro guide documentation](https://num.pyro.ai/en/stable/autoguide.html).
```{python}
guide = AutoMultivariateNormal(
    model,
    init_loc_fn=init_to_value(values={"alpha": 1.0, "gamma": 1.0}),
    init_scale=0.05,
)
svi = SVI(model, guide, Adam(0.005), Trace_ELBO(num_particles=8))
svi_result = svi.run(jax.random.key(3), 4000, data=observed, progress_bar=False)
svi_samples = guide.sample_posterior(
    jax.random.key(4), svi_result.params, sample_shape=(1200,),
)
```
```{python}
#| code-fold: true
#| code-summary: "Inspect the SVI objective"
fig, ax = plt.subplots(figsize=(6, 3))
ax.plot(svi_result.losses, alpha=0.6)
ax.set(xlabel="Optimization step", ylabel="Negative ELBO (lower is better)")
fig.tight_layout()
plt.show()
```
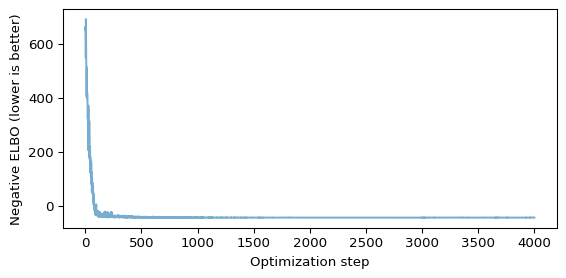
Both methods use the same `model`. Here SVI optimizes a distribution with a
learned spread. Its speed and accuracy depend on the guide and optimization;
a stable loss alone does not establish accurate uncertainty.
Here we initialize at the prior medians, with a small spread in log rates, and
average eight Monte Carlo draws per step to reduce noise in the objective.
For your own problem, check sensitivity to initialization and optimization length.
## 6. Compare parameter uncertainty and predictions
A point estimate gives one parameter pair. Posterior draws also describe the
remaining spread and dependence, conditional on the priors, observation model,
and fixed quantities above.
### Marginal distributions and credible intervals
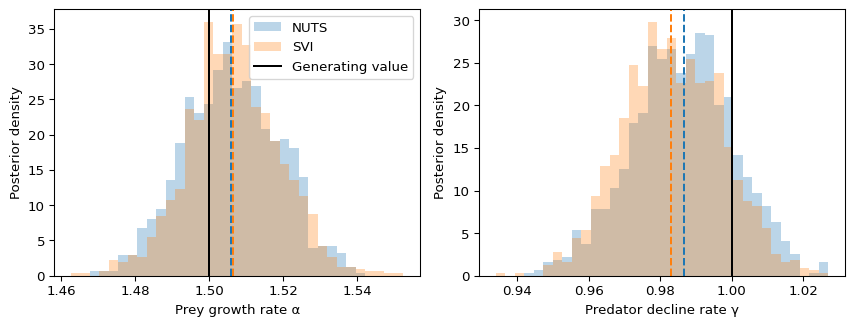
A **marginal posterior** describes one parameter while accounting for uncertainty
in the other. The histograms below estimate these densities from NUTS and SVI
draws. Their width shows remaining parameter uncertainty; their area is one.
Dashed colored lines mark posterior medians, and the black line marks the known
generating value.
```{python}
parameter_samples = {"NUTS": nuts_samples, "SVI": svi_samples}
quantiles = jnp.array([0.05, 0.50, 0.95])
parameter_intervals = {
    label: {name: jnp.quantile(samples[name], quantiles) for name in truth}
    for label, samples in parameter_samples.items()
}
```
```{python}
#| code-fold: true
#| code-summary: "Plot marginal posterior densities and medians"
fig, axes = plt.subplots(1, 2, figsize=(9, 3.5))
for ax, name, title in zip(
    axes, truth, ("Prey growth rate α", "Predator decline rate γ")
):
    combined = jnp.concatenate([samples[name] for samples in parameter_samples.values()])
    bins = jnp.linspace(combined.min(), combined.max(), 36)
    for color, (label, samples) in zip(("tab:blue", "tab:orange"), parameter_samples.items()):
        ax.hist(samples[name], bins=bins, density=True, histtype="stepfilled",
                alpha=0.3, color=color, label=label)
        ax.axvline(float(parameter_intervals[label][name][1]), color=color, ls="--")
    ax.axvline(truth[name], color="black", label="Generating value")
    ax.set(xlabel=title, ylabel="Posterior density")
axes[0].legend()
fig.tight_layout()
plt.show()
```
For a compact numerical report, use the median and a **90% equal-tailed credible
interval**: the 5th and 95th percentiles, leaving 5% of the marginal posterior
mass on either side. The table estimates these summaries from the draws;
SVI intervals describe its fitted approximation.
```{python}
#| results: asis
#| code-fold: true
#| code-summary: "Display the parameter summary table"
from IPython.display import Markdown, display

rows = [
    "| Parameter | Method | Median | 90% credible interval | Generating value |",
    "|:--|:--|--:|:--|--:|",
]
for name in truth:
    for label in parameter_samples:
        lo, median, hi = parameter_intervals[label][name]
        rows.append(
            f"| {name} | {label} | {median:.3f} | [{lo:.3f}, {hi:.3f}] | {truth[name]:.3f} |"
        )
display(Markdown("\n".join(rows)))
```
NUTS and SVI agree closely here. We infer only two rates, observe both
populations, and keep the other quantities fixed. The narrow posterior appears
approximately Gaussian in log-rate coordinates, which suits the guide.
For skewed, curved, or multimodal posteriors, this guide may miss important
structure. Agreement of medians and central intervals does not establish
agreement in the tails or replace sampling diagnostics.
Under the specified model and given the observations, a 90% credible interval
contains 90% of the parameter's posterior probability. A frequentist
**confidence interval** instead has a repeated-sampling coverage interpretation.
We use "credible interval" for these Bayesian summaries.
The interval width describes uncertainty in the parameter, not numerical error
in estimating its posterior median. More well-mixed NUTS draws improve Monte
Carlo precision; they do not remove uncertainty caused by limited observations.
A single synthetic fit also cannot establish that intervals are calibrated
across repeated datasets.
### Joint parameter uncertainty
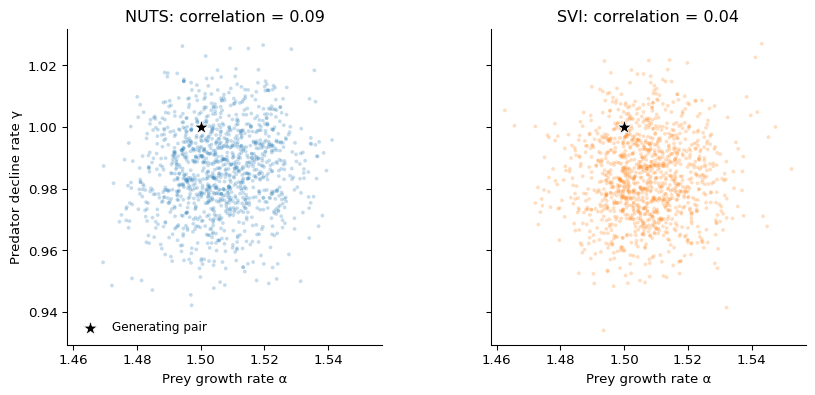
Marginal intervals do not show which parameter combinations are plausible
together. Separate panels show the joint draws from each method on the same
axes, with their sample correlation reported in the titles. In this example,
dependence is weak, so the clouds can look nearly circular. A pronounced tilt
is not a requirement for a valid posterior or a feature specific to NUTS:
the SVI guide used here can also represent correlations. More NUTS draws improve
the precision of the estimated correlation; they do not create stronger
dependence. The stimulation case study provides a clearer parameter trade-off.
The two marginal 90%
intervals do not define a joint 90% credible region. The black star marks the
generating parameter pair.
```{python}
#| code-fold: true
#| code-summary: "Compare joint parameter distributions"
fig, axes = plt.subplots(1, 2, figsize=(9, 4), sharex=True, sharey=True,
                         layout="constrained")
for ax, (label, samples), color in zip(
    axes, parameter_samples.items(), ("tab:blue", "tab:orange")
):
    correlation = float(jnp.corrcoef(samples["alpha"], samples["gamma"])[0, 1])
    ax.scatter(samples["alpha"], samples["gamma"], s=8, alpha=0.25,
               color=color, edgecolors="none", rasterized=True)
    ax.scatter(truth["alpha"], truth["gamma"], color="black", marker="*", s=130,
               edgecolor="white", linewidth=0.6, label="Generating pair", zorder=5)
    ax.set(xlabel="Prey growth rate α", title=f"{label}: correlation = {correlation:.2f}")
    ax.set_box_aspect(1)
    ax.spines[["top", "right"]].set_visible(False)
axes[0].set_ylabel("Predator decline rate γ")
axes[0].legend(frameon=False, fontsize=9)
plt.show()
```
### From parameter uncertainty to predictive intervals
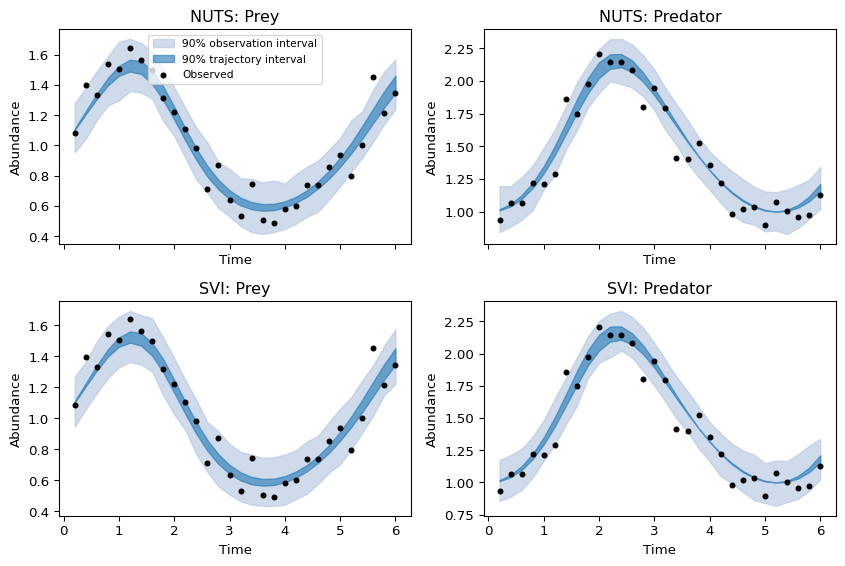
A posterior predictive check asks what new measurements the fitted model would
produce. The **trajectory interval** reflects parameter uncertainty; the
**observation interval** additionally includes measurement noise. We keep complete
parameter pairs and use draws from both NUTS chains. The 90% intervals are
pointwise at the recorded times, not simultaneous bands over the entire response.
These checks reuse the fitting data; they do not validate predictions on a new
recording.
```{python}
posterior_predictions = {}
for seed, (label, samples) in enumerate(
    (("NUTS", nuts_samples), ("SVI", svi_samples)), start=5,
):
    # Evenly spaced draws span both sequential NUTS chains.
    take = jnp.linspace(0, len(samples["alpha"]) - 1, 300).astype(int)
    draws = {name: samples[name][take] for name in truth}
    posterior_predictions[label] = Predictive(model, posterior_samples=draws)(
        jax.random.key(seed)
    )
```
```{python}
#| code-fold: true
#| code-summary: "Compare trajectory and observation intervals"
fig, axes = plt.subplots(2, 2, figsize=(9, 6), sharex=True)
for row, (label, predictions) in enumerate(posterior_predictions.items()):
    for i, ax in enumerate(axes[row]):
        for site, color, caption in (
            ("obs", "lightsteelblue", "90% observation interval"),
            ("trajectory", "tab:blue", "90% trajectory interval"),
        ):
            lo, hi = jnp.quantile(predictions[site][:, :, i], jnp.array([0.05, 0.95]), axis=0)
            ax.fill_between(times, lo, hi, color=color, alpha=0.6, label=caption)
        ax.scatter(times, observed[:, i], s=12, color="black", label="Observed")
        ax.set(title=f"{label}: {('Prey', 'Predator')[i]}", xlabel="Time", ylabel="Abundance")
axes[0, 0].legend(fontsize=8)
fig.tight_layout()
plt.show()
```
## Using your own model
Replace `predict` with your prepared tvboptim simulation, align its outputs with
your measurement times, and define priors and a likelihood appropriate to those
measurements. The NUTS and SVI calls can retain the same structure.
Before interpreting an ODE posterior, check that reducing the integration step
(or tightening adaptive solver tolerances) does not materially change predictions
and inference. The posterior here is conditional on known initial conditions,
fixed interaction rates, known noise, and the chosen observation model. Relaxing
those assumptions can increase uncertainty and make inference harder.
For a next experiment, observe fewer time points and repeat both fits: how do
the parameter cloud and predictive intervals change? Then try inferring the
noise scale with a positive prior.
Continue with [Bayesian Stimulation Inference: Identifiability and Prior Sensitivity](../workflows/Stimulation_Prior_Sensitivity.qmd)
to study an experiment where different parameter combinations produce similar
responses. It connects Fisher information, posterior dependence, and shifted
priors, then compares posterior draws with maximum a posteriori (MAP) point
estimates. Both optimization and sampling can incorporate priors; the posterior
distribution also describes the uncertainty around a point estimate.
## Further directions
For larger models, inference cost depends on simulation and differentiation
cost, posterior geometry, and the number of parameters. A dense NUTS mass matrix
uses quadratic storage in parameter count; faster gradients alone do not make
large inference problems easy. The [NumPyro SVI guide](https://num.pyro.ai/en/stable/svi.html)
extends the variational approach used here, but the guide family and convergence
still need checking against diagnostics and, where feasible, posterior samples.
When a likelihood is difficult to evaluate, neural simulation-based inference
(SBI) offers another route: draw parameters from a prior, simulate observations
or summaries, and train a conditional density estimator to approximate the
posterior. The [sbi Bayesian workflow](https://sbi.readthedocs.io/en/stable/tutorials/01_Bayesian_workflow.html)
describes this process and its validation. Summary choice can discard information;
training simulations and calibration checks are additional costs, and SBI does
not automatically solve high-dimensional inference.
If the goal is to explore competing objectives, see the
[parallel Pareto optimization workflow](../workflows/Hopf_Pareto_ParallelOpt.qmd).
A Pareto front describes objective trade-offs; Bayesian uncertainty still
requires a probabilistic model and inference.