---
title: "Extending Coupling 1: Surface Simulations"
subtitle: "Recreating TVB's Surface Simulations with Subspace Coupling"
format:
html:
code-fold: false
toc: true
toc-depth: 3
fig-width: 8
out-width: "100%"
jupyter: python3
execute:
cache: true
---
Try this notebook interactively:
[Download .ipynb](https://github.com/virtual-twin/tvboptim/blob/main/docs/advanced/subspace_coupling.ipynb){.btn .btn-primary download="subspace_coupling.ipynb"}
[Download .qmd](subspace_coupling.qmd){.btn .btn-secondary download="subspace_coupling.qmd"}
[Open in Colab](https://colab.research.google.com/github/virtual-twin/tvboptim/blob/main/docs/advanced/subspace_coupling.ipynb){.btn .btn-warning target="_blank"}
# Introduction
Subspace coupling evaluates a network interaction at a coarser resolution than the one the network is simulated at. Fine-grained nodes are grouped into regions, and the long-range coupling acts between regions rather than between individual nodes. Cortical surface models are the canonical case: tens of thousands of vertices carry the local dynamics, while white matter tracts connect a few hundred anatomical parcels.
The construction has three stages. Node states are **aggregated** to regions, the inner coupling is **applied** on the regional graph, and the result is **distributed** back to the nodes. `SubspaceCoupling` implements this through the ordinary coupling interface, `prepare()`, `precompute()`, `compute()` and `update_state()`, so a hierarchical coupling is assembled and solved like any other.
## Use Case: Surface Simulations
In The Virtual Brain (TVB), surface simulations resolve cortical activity at the vertex level while carrying long-range connectivity at the resolution of a structural connectome. That gives a two-level hierarchy:
- **Node level**: Fine-grained cortical vertices with local connectivity
- **Regional level**: Coarse anatomical parcels with long-range delayed connectivity
```{python}
#| output: false
#| echo: false
# Install dependencies if running in Google Colab
try:
import google.colab
print("Running in Google Colab - installing dependencies...")
!pip install -q tvboptim
print("✓ Dependencies installed!")
except ImportError:
pass # Not in Colab, assume dependencies are available
```
```{python}
#| code-fold: true
#| code-summary: "Environment Setup and Imports"
import time

import jax
import jax.numpy as jnp
import matplotlib.pyplot as plt
from mpl_toolkits.axes_grid1.inset_locator import inset_axes, mark_inset

from tvboptim.experimental.network_dynamics import Network, solve
from tvboptim.experimental.network_dynamics.coupling import (
    DelayedLinearCoupling,
    LinearCoupling,
    SubspaceCoupling,
)
from tvboptim.experimental.network_dynamics.dynamics.tvb import ReducedWongWang
from tvboptim.experimental.network_dynamics.graph import SparseGraph, DenseDelayGraph
from tvboptim.experimental.network_dynamics.solvers import Euler
from tvboptim.experimental.network_dynamics.utils import print_network
```
# The Subspace Coupling Pattern
## Conceptual Overview
Subspace coupling operates in three stages:
```
1. AGGREGATE:  [n_states, n_nodes] → [n_states, n_regions]
2. COUPLE:     Apply coupling at regional level
3. DISTRIBUTE: [n_coupling, n_regions] → [n_coupling, n_nodes]
```
**Stage 1 (Aggregate)**: Average node states within each region
$$
s_r = \frac{1}{|R_r|} \sum_{i \in R_r} s_i
$$
**Stage 2 (Couple)**: Apply inner coupling on regional graph
$$
c_r = \sum_{r'} w_{rr'} f(s_{r'}(t - \tau_{rr'}))
$$
**Stage 3 (Distribute)**: Broadcast regional coupling to constituent nodes
$$
c_i = c_{\text{region}(i)}
$$
## Implementation: The Coupling API
The snippets below are condensed from `SubspaceCoupling`, with validation and the sparse code path removed. They show where each stage lands in the coupling interface.
### Phase 1: `prepare()` - Build the Regional Structures
```python
def prepare(self, network, dt, t0, t1):
    """Build the aggregation matrix and prepare the inner coupling."""

    # Normalized aggregation matrix [n_nodes, n_regions].
    # Each node contributes 1/|region| to its region's mean.
    region_one_hot = jnp.eye(self.n_regions)[self.region_mapping]
    region_counts = jnp.sum(region_one_hot, axis=0)

    coupling_data = Bunch(
        region_one_hot_normalized=region_one_hot / region_counts[None, :],
        region_mapping=self.region_mapping,
    )

    # A Network-like view of the regional graph, so the inner coupling can be
    # prepared without knowing that it sits inside a hierarchy.
    regional_context = self._create_regional_context(network, ...)
    inner_data, inner_state = self.inner_coupling.prepare(
        regional_context, dt, t0, t1
    )
    coupling_data.inner_data = inner_data

    # Seed the cache, so the first compute() has a regional state to read.
    coupling_state = Bunch(
        inner_state=inner_state,
        cached_regional_state=self.aggregate(network.initial_state, coupling_data),
    )
    return coupling_data, coupling_state
```
The aggregation matrix is built once here rather than rebuilt per step. When nodes greatly outnumber regions the matrix is overwhelmingly zero, so it is stored in sparse BCOO format by default (`use_sparse=True`).
### Phase 2: `precompute()` - Hand the Inner Coupling Its Own Data
```python
def precompute(self, coupling_data, params, graph):
    """Run the inner coupling's own per-call setup on the regional graph."""
    coupling_data = coupling_data.copy()
    inner_data = coupling_data.inner_data.copy()

    # The solver writes its stage-time fields into the outer coupling_data.
    # The inner coupling never sees them unless they are forwarded.
    for field in ("stage_time_centroid", "recompute_coupling_per_stage"):
        if field in coupling_data:
            inner_data[field] = coupling_data[field]

    coupling_data.inner_data = self.inner_coupling.precompute(
        inner_data, self.inner_coupling.params, self.regional_graph
    )
    return coupling_data
```
This phase is not optional for a delayed inner coupling. A `DelayedCoupling` resolves its delay read indices in `precompute()`, not in `prepare()`, so forwarding the call is what keeps `compute()` from receiving unresolved data. Forwarding the stage-time fields gives the inner coupling the same stage-time correction the node-level couplings get, discussed in [Coupling Freezing and Solver Order](coupling_freezing.qmd).
### Phase 3: `compute()` - Aggregate, Couple, Distribute
```python
def compute(self, t, state, coupling_data, coupling_state, params, graph):
    """Aggregate → couple → distribute."""

    # Stage 1: Use cached aggregated regional state
    # (computed in previous update_state, avoids redundant aggregation)
    regional_state = coupling_state.cached_regional_state
    # Shape: [n_states, n_regions]

    # Stage 2: Compute coupling at regional level
    regional_coupling = self.inner_coupling.compute(
        t,
        regional_state,
        coupling_data.inner_data,
        coupling_state.inner_state,
        self.inner_coupling.params,
        self.regional_graph  # Regional connectivity
    )
    # Shape: [n_coupling_inputs, n_regions]

    # Stage 3: Distribute regional coupling to nodes (broadcast)
    node_coupling = self.distribute(regional_coupling, coupling_data)
    # Shape: [n_coupling_inputs, n_nodes]

    return node_coupling
```
`compute()` never aggregates. It reads the regional state that `update_state()` already cached at the end of the previous step, which is why the `state` argument goes unused.
### Phase 4: `update_state()` - Advance and Cache
```python
def update_state(self, coupling_data, coupling_state, new_state):
    """Update inner coupling state and cache new aggregated state."""

    # Aggregate new node state to regional state
    regional_state = self.aggregate(new_state, coupling_data)

    # Update inner coupling (e.g., delay buffer with regional states)
    new_inner_state = self.inner_coupling.update_state(
        coupling_data.inner_data,
        coupling_state.inner_state,
        regional_state  # Regional state for delay buffer
    )

    # Cache aggregated state for next compute()
    return Bunch(
        inner_state=new_inner_state,
        cached_regional_state=regional_state
    )
```
Aggregating here rather than in `compute()` means one aggregation per step instead of one per solver stage, and the cached result is what the next `compute()` reads.
## Aggregate and Distribute Methods
These two methods define the projection between node and regional space, and are the intended override points:
```python
def aggregate(self, node_state, coupling_data):
    """Aggregate node states to regional states (default: mean)."""
    # node_state: [n_states, n_nodes]
    # region_one_hot_normalized: [n_nodes, n_regions]

    regional_state = node_state @ coupling_data.region_one_hot_normalized
    # Shape: [n_states, n_regions]

    return regional_state

def distribute(self, regional_coupling, coupling_data):
    """Distribute regional coupling to nodes (default: broadcast)."""
    # regional_coupling: [n_coupling_inputs, n_regions]
    # region_mapping: [n_nodes] with region IDs

    node_coupling = regional_coupling[:, coupling_data.region_mapping]
    # Shape: [n_coupling_inputs, n_nodes]

    return node_coupling
```
Override them for other strategies, such as area-weighted aggregation or a distribution that scales each node by its share of the parcel. Both receive the whole `coupling_data`, so an override may read anything `prepare()` stored.
# Practical Example: Mixed Coupling
Let's create a realistically sized surface simulation with both local and regional coupling:
The connectivity below is synthetic. In particular `region_mapping` assigns each vertex to a region at random, whereas an anatomical parcellation assigns contiguous patches of surface. That difference does not affect the mechanics shown here, but it does make the regional means far less correlated than in a real surface model, so do not read the dynamics as representative.
```{python}
# Network dimensions
n_nodes = 16000  # Cortical vertices
n_regions = 76   # Brain regions
t0, t1, dt = 0.0, 1000.0, 1.0

# Regional connectivity: Structural connectome with delays
region_mapping = jax.random.randint(
    jax.random.key(42), (n_nodes,), 0, n_regions
)

regional_graph = DenseDelayGraph.random(
    n_nodes=n_regions,
    density=0.8,       # 80% of connections present
    max_delay=50.0,    # ~150mm at 3 m/s
    key=jax.random.key(0)
)

# Local connectivity: Sparse short-range connections
node_graph = SparseGraph.random(
    n_nodes=n_nodes,
    density=0.000366,  # 0.0366% connectivity (typical density, depending on kernel)
    key=jax.random.key(1)
)

print(f"Local graph: {node_graph.nnz:,} edges (sparse)")
print(f"Regional graph: {n_regions}×{n_regions} (dense with delays)")
```
## Network Construction
Now create a network with two coupling types:
1. **Instantaneous local coupling**: Fast connections between nearby vertices
2. **Delayed regional coupling**: Long-range connections between brain regions
```{python}
# Local instantaneous coupling
coupling_instant = LinearCoupling(source='S', G=0.2)

# Regional delayed coupling via subspace
coupling_delayed = SubspaceCoupling(
    inner_coupling=DelayedLinearCoupling(source='S', G=0.05),
    region_mapping=region_mapping,
    regional_graph=regional_graph,
)

# Multi-coupling network
network = Network(
    dynamics=ReducedWongWang(I_o=0.1),
    coupling={
        'instant': coupling_instant,   # Local vertices
        'delayed': coupling_delayed    # Regional subspace
    },
    graph=node_graph
)

print(network)
```
**Key point**: The dynamics model (`ReducedWongWang`) declares two coupling inputs (`instant` and `delayed`). The network provides both through named couplings operating at different spatial scales.
## Simulation
```{python}
# First call compiles and runs; block_until_ready defeats JAX's async dispatch
# so that the timing covers execution rather than only the dispatch.
start = time.perf_counter()
result = solve(network, Euler(), t0=t0, t1=t1, dt=dt)
jax.block_until_ready(result.ys)
first_call = time.perf_counter() - start

start = time.perf_counter()
result = solve(network, Euler(), t0=t0, t1=t1, dt=dt)
jax.block_until_ready(result.ys)
warm_call = time.perf_counter() - start

print(f"First call (compile + run): {first_call:.2f} s")
print(f"Warm call (run only):       {warm_call:.2f} s")
print(f"Result shape: {result.ys.shape}")
print(f"Time points: [{result.ts[0]:.1f}, {result.ts[-1]:.1f}] ms")
```
# Network Inspection
The network printer reveals the hierarchical structure:
```{python}
print_network(network)
```
The printer reports each coupling at the scale it acts on: `instant` on the sparse node graph, `delayed` on the 76-region graph together with its aggregation and distribution steps, and the maximum delay carried by the regional connectome.
# History for a Delayed Regional Coupling
A delayed inner coupling needs a history buffer, and that buffer lives at the regional scale. Node-level history is therefore aggregated before it is written, which happens without any action on your part: continuing a simulation from a previous one works exactly as it does for a flat network.
```{python}
# Run initial simulation
sim1 = solve(network, Euler(), t0=0.0, t1=500.0, dt=1.0)

# Set as history and continue
network.update_history(sim1)
sim2 = solve(network, Euler(), t0=500.0, t1=1000.0, dt=1.0)

print(f"First simulation:  {sim1.ys.shape}")
print(f"Second simulation: {sim2.ys.shape}")
```
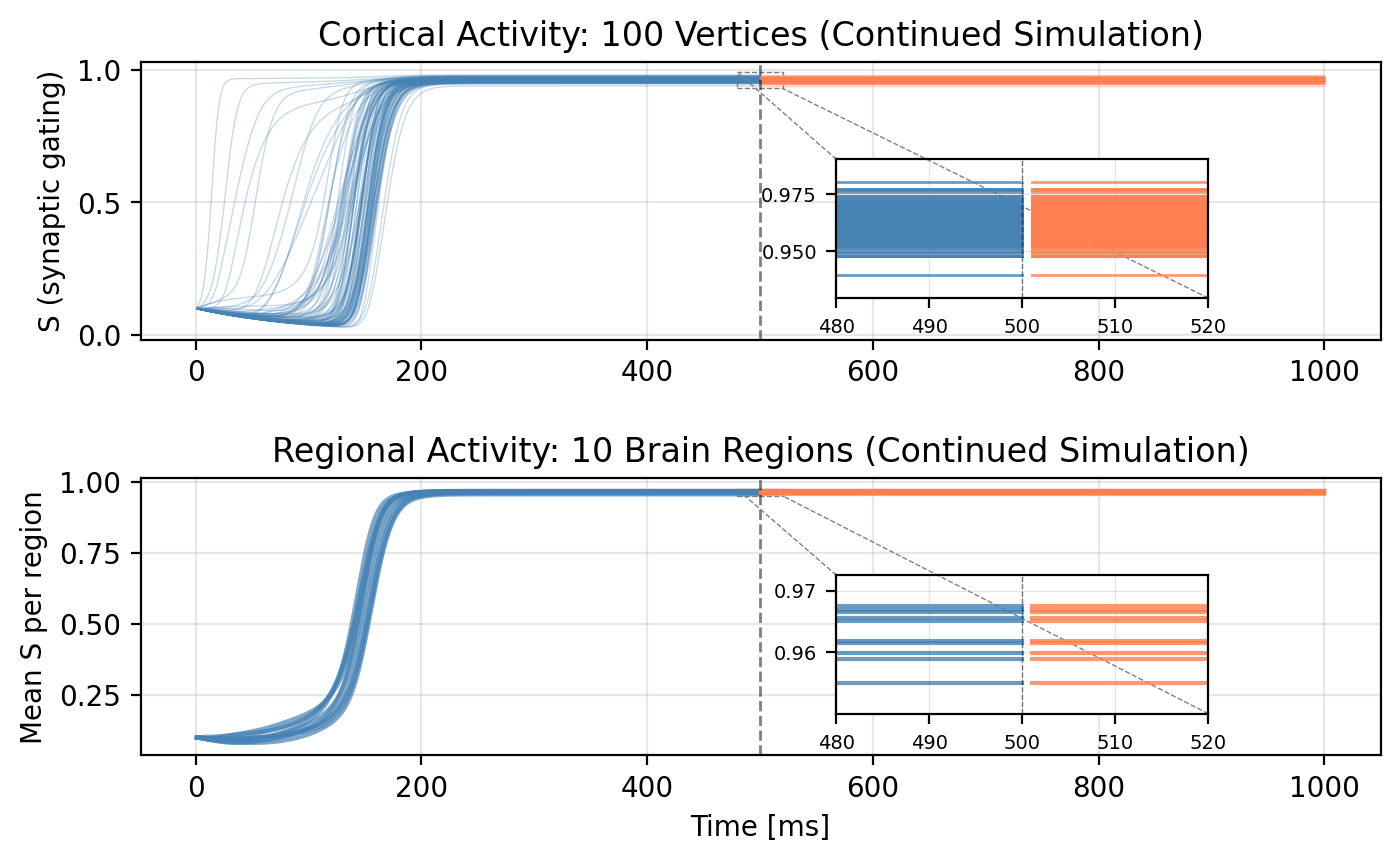
`update_history()` stores the node-level trajectory, and the regional context aggregates it into the regional delay buffer when the next solve prepares. The plot below zooms on the junction at $t = 500$: the two runs meet without a step, which is what a correctly reconstructed history buffer looks like.
## Visualize Continued Simulation
```{python}
#| code-fold: true
#| code-summary: "Visualization: Continuity at Simulation Boundary"
fig, axes = plt.subplots(2, 1, figsize=(8, 4.5), dpi=200)
# tight_layout cannot lay out the inset axes below, so spacing is set here.
fig.subplots_adjust(hspace=0.5)

# The two simulations meet at t = 500, so the zoom window spans both.
zoom1 = slice(479, 500)   # sim1: t = 480 .. 500
zoom2 = slice(0, 20)      # sim2: t = 501 .. 520

# Sample 100 vertices
sample_indices = jnp.linspace(0, n_nodes-1, 100, dtype=int)

# Vertex time series: sim1 and sim2
axes[0].plot(sim1.ts, sim1.ys[:, 0, sample_indices],
             alpha=0.3, linewidth=0.5, color='steelblue', label='Sim 1')
axes[0].plot(sim2.ts, sim2.ys[:, 0, sample_indices],
             alpha=0.3, linewidth=0.5, color='coral', label='Sim 2')
axes[0].axvline(500, color='black', linestyle='--', linewidth=1, alpha=0.5)
axes[0].set_ylabel('S (synaptic gating)')
axes[0].set_title(f'Cortical Activity: {len(sample_indices)} Vertices (Continued Simulation)')
axes[0].grid(True, alpha=0.3)

# Add zoom inset for vertices
axins0 = inset_axes(axes[0], width="30%", height="50%", loc='lower left',
                    bbox_to_anchor=(0.55, 0.1, 1, 1), bbox_transform=axes[0].transAxes)
axins0.plot(sim1.ts, sim1.ys[:, 0, sample_indices[:]],
            alpha=0.8, linewidth=1, color='steelblue')
axins0.plot(sim2.ts, sim2.ys[:, 0, sample_indices[:]],
            alpha=0.8, linewidth=1, color='coral')
axins0.axvline(500, color='black', linestyle='--', linewidth=0.5, alpha=0.5)
axins0.set_xlim(480, 520)
axins0.set_ylim(
    min(sim1.ys[zoom1, 0, sample_indices].min(),
        sim2.ys[zoom2, 0, sample_indices].min()) - 0.01,
    max(sim1.ys[zoom1, 0, sample_indices].max(),
        sim2.ys[zoom2, 0, sample_indices].max()) + 0.01,
)
axins0.grid(True, alpha=0.3, linewidth=0.5)
axins0.tick_params(labelsize=7)
mark_inset(axes[0], axins0, loc1=2, loc2=4, fc="none", ec="0.5", linestyle='--', linewidth=0.5)

# Mean regional activity
regional_activity_sim1 = []
regional_activity_sim2 = []
for r in range(n_regions):
    mask = region_mapping == r
    regional_activity_sim1.append(jnp.mean(sim1.ys[:, 0, mask], axis=1))
    regional_activity_sim2.append(jnp.mean(sim2.ys[:, 0, mask], axis=1))

regional_activity_sim1 = jnp.array(regional_activity_sim1).T  # [time, n_regions]
regional_activity_sim2 = jnp.array(regional_activity_sim2).T

# Plot first 10 regions
axes[1].plot(sim1.ts, regional_activity_sim1[:, :10],
             alpha=0.7, linewidth=1.5, color='steelblue')
axes[1].plot(sim2.ts, regional_activity_sim2[:, :10],
             alpha=0.7, linewidth=1.5, color='coral')
axes[1].axvline(500, color='black', linestyle='--', linewidth=1, alpha=0.5)
axes[1].set_xlabel('Time [ms]')
axes[1].set_ylabel('Mean S per region')
axes[1].set_title('Regional Activity: 10 Brain Regions (Continued Simulation)')
axes[1].grid(True, alpha=0.3)

# Add zoom inset for regional activity
axins1 = inset_axes(axes[1], width="30%", height="50%", loc='lower left',
                    bbox_to_anchor=(0.55, 0.1, 1, 1), bbox_transform=axes[1].transAxes)
axins1.plot(sim1.ts, regional_activity_sim1[:, :10],
            alpha=0.8, linewidth=1.5, color='steelblue')
axins1.plot(sim2.ts, regional_activity_sim2[:, :10],
            alpha=0.8, linewidth=1.5, color='coral')
axins1.axvline(500, color='black', linestyle='--', linewidth=0.5, alpha=0.5)
axins1.set_xlim(480, 520)
axins1.set_ylim(
    min(regional_activity_sim1[zoom1, :10].min(),
        regional_activity_sim2[zoom2, :10].min()) - 0.005,
    max(regional_activity_sim1[zoom1, :10].max(),
        regional_activity_sim2[zoom2, :10].max()) + 0.005,
)
axins1.grid(True, alpha=0.3, linewidth=0.5)
axins1.tick_params(labelsize=7)
mark_inset(axes[1], axins1, loc1=2, loc2=4, fc="none", ec="0.5", linestyle='--', linewidth=0.5)

plt.show()
```
# What Makes the Pattern Work
**Two state representations.** The coupling holds node states `[n_states, n_nodes]` for the full surface and regional states `[n_states, n_regions]` for the parcels, and moves between them by a single matrix product against the aggregation matrix built in `prepare()`.
**Three costs avoided.** The aggregation matrix is built once rather than per step; the aggregated state is cached in `update_state()` rather than recomputed in `compute()`; and the matrix is stored as BCOO whenever nodes greatly outnumber regions, which is the regime the pattern exists for.
**Composition rather than a special case.** `SubspaceCoupling` wraps any inner coupling, instantaneous or delayed, and the inner coupling only ever sees the regional graph. It cannot tell that it sits inside a hierarchy, which is what allows local and regional couplings to be mixed freely in one network, or several regional couplings to run with different parameters.
**A minimal network view.** The inner coupling's `prepare()` expects a `Network`. Rather than construct one, `SubspaceCoupling` passes a small internal context object exposing only what `prepare()` reads: the regional graph, the dynamics for state-name resolution, and a `get_history()` that aggregates node history to regional history.